How to Open Task Manager on Mac (It's Called Activity Monitor)
macOS has no Task Manager — it has Activity Monitor, plus a separate Force Quit window. Here is how to open both and read what they tell you.
Short answer
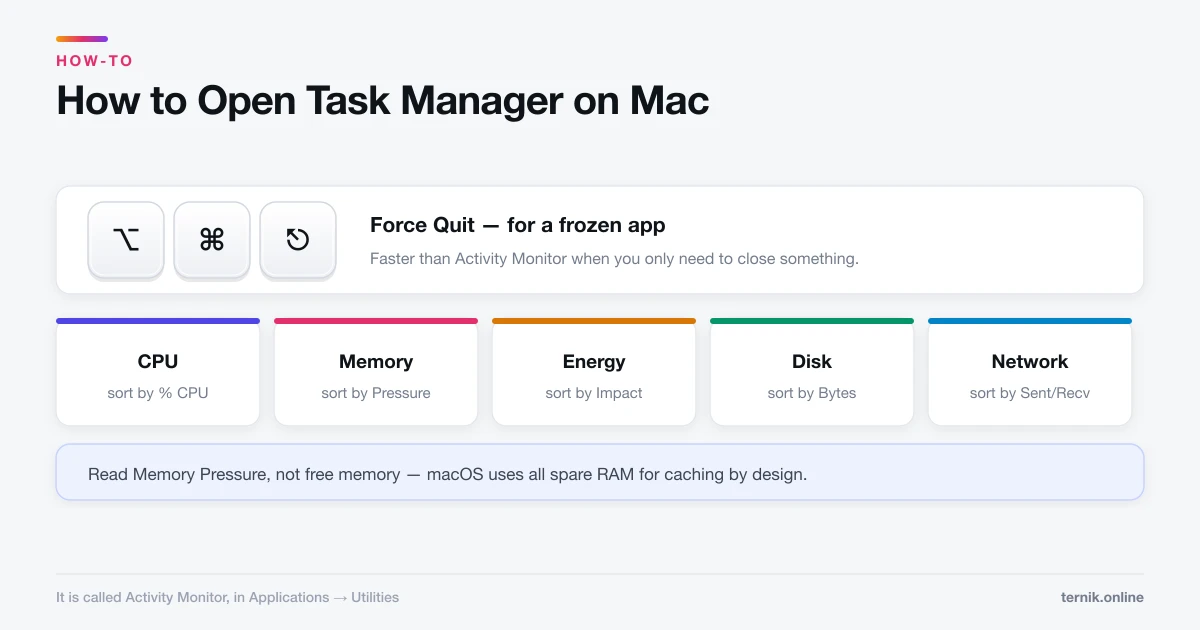
The Mac equivalent of Task Manager is Activity Monitor, in Applications > Utilities. Open it fastest with Command-Space, typing Activity Monitor, and pressing Return. For simply closing a frozen app, Option-Command-Escape opens the Force Quit window, which is quicker.
Key takeaways
- The Mac equivalent is Activity Monitor (Applications → Utilities), not "Task Manager".
- Fastest route: ⌘Space → type
activity monitor→ Return. - For a frozen app, ⌥⌘⎋ opens Force Quit — quicker than Activity Monitor.
- Five tabs: CPU, Memory, Energy, Disk, Network.
- Memory Pressure, not "memory free", is the number that tells you if RAM is short.
What is the Mac version of Task Manager?
Activity Monitor. It shows every running process with its CPU, memory, energy, disk, and network use, and it can quit anything that misbehaves.
Three ways in:
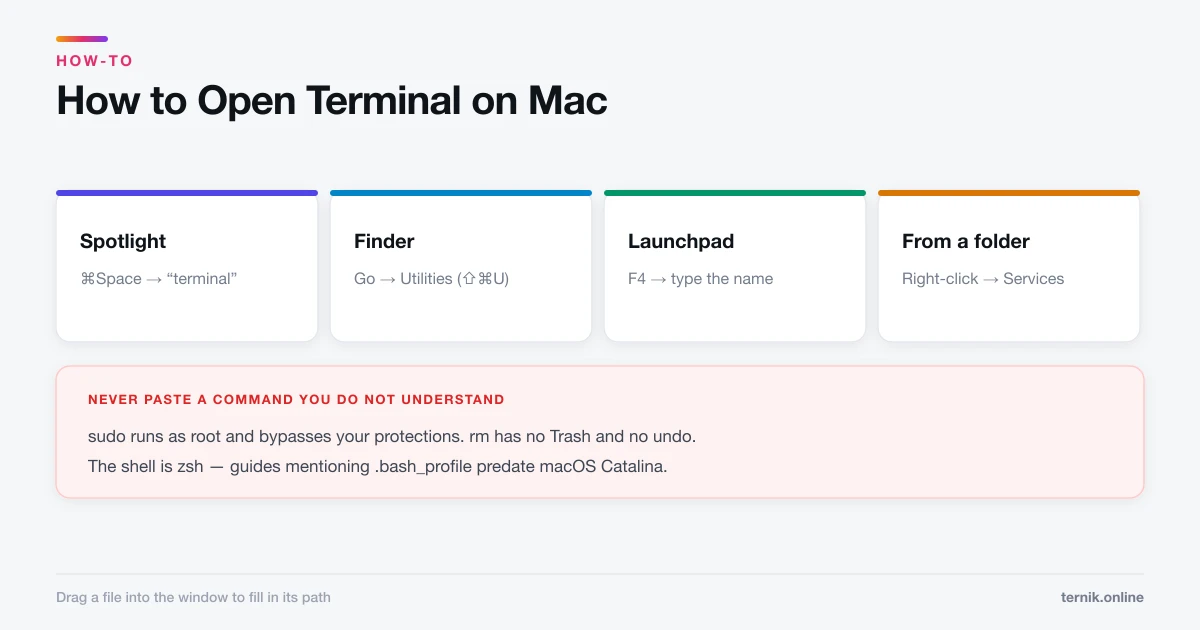
- Spotlight — ⌘Space, type
activity monitor, Return. - Finder — Go → Utilities (⇧⌘U), then double-click Activity Monitor.
- Launchpad — press F4 and type the name.
If you use it regularly, keep it in the Dock: right-click its icon → Options → Keep in Dock.
The faster tool for a frozen app
If all you want is to close something that has stopped responding, do not open Activity Monitor. Press Option-Command-Escape. The Force Quit Applications window lists your open apps; select the unresponsive one and click Force Quit.
Frozen apps appear as "(Not Responding)". You can also force quit from the Dock — right-click the icon while holding Option and the Quit item becomes Force Quit.
Force quitting discards unsaved work in that app. Everything else is unaffected.
Reading the five tabs
| Tab | Sort by | Tells you |
|---|---|---|
| CPU | % CPU | What is making the fans run |
| Memory | Memory | What is consuming RAM |
| Energy | Energy Impact | What is draining the battery |
| Disk | Bytes Written | What is hammering the SSD |
| Network | Sent/Received | What is using bandwidth |
CPU is where nearly every "why is my Mac slow" investigation starts. Sort by % CPU descending and look at the top row. One process pinned near 100% explains most cases.
Memory is the most misread tab. Ignore how little memory is free — macOS deliberately uses everything available for caching. The number that matters is Memory Pressure at the bottom: green is fine, yellow means compression is happening, red means you genuinely need more RAM or fewer apps.
Energy is the one to check when a laptop battery is disappearing. Energy Impact accounts for more than raw CPU, so it is the honest measure.
Processes that look alarming and are not
Several normal macOS processes routinely worry people:
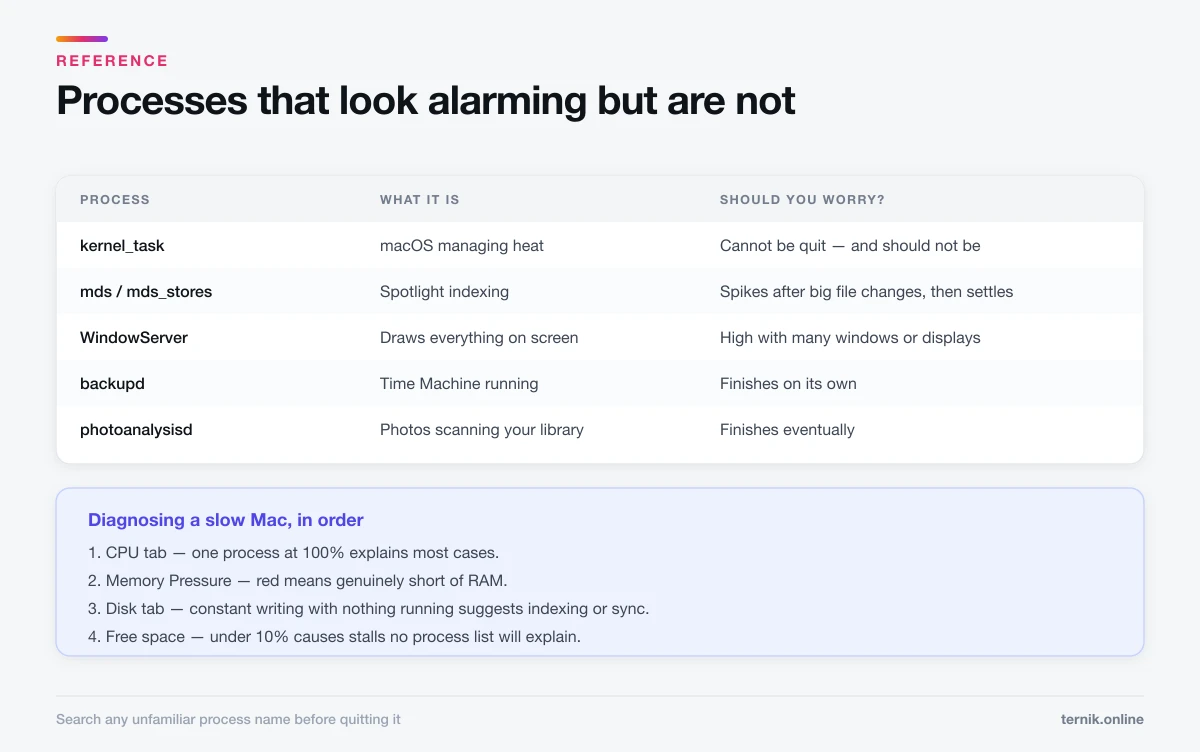
- kernel_task — high usage here is often macOS managing heat deliberately. Do not quit it; you cannot anyway.
- mds / mds_stores — Spotlight indexing. Spikes after large file changes, then settles.
- WindowServer — draws everything on screen. High with many windows or external displays.
- backupd — Time Machine running.
- photoanalysisd — Photos scanning your library. Finishes eventually.
Before quitting anything unfamiliar, search the exact process name. Quitting the wrong system process can log you out or destabilise the session. This is also the first place to look for genuinely unwanted software — the audit in how to check for malware starts here for exactly that reason.
Quitting a process properly
Select it, click the ⊗ in the toolbar, then choose:
- Quit — asks politely, lets the app save. Try this first.
- Force Quit — kills it immediately, discarding unsaved work.
If a process reappears after every restart, quitting it is treating the symptom. It is being launched by a login item or background agent — check System Settings → General → Login Items.
Using it to diagnose a slow Mac
Activity Monitor is the first stop, not the whole answer. A practical order:
- Check CPU. One process at 100% → deal with that process.
- Check Memory Pressure. Red → close apps, or accept that the machine needs more RAM.
- Check Disk. Constant writing with nothing running suggests indexing or a sync client.
- Check free space. Under about 10% free causes stalls no process list will explain.
- If nothing stands out, the cause may be lower down — boot into safe mode to separate software from hardware, then run Apple Diagnostics.
Clearing caches is worth trying only when a specific app is corrupt, not as a general speed fix — how to clear cache on a Mac explains why. And if a slow Mac turns out to be full of software you never installed, removing it properly does more than any cleanup utility.
Two settings worth changing
Dock icon as a live graph. Right-click the Dock icon → Dock Icon → Show CPU History. You get a running CPU graph without keeping the window open.
Update frequency. View → Update Frequency → Very Often (1 sec) when chasing a brief spike; Less Often when leaving it open all day, since Activity Monitor itself uses resources.
Frequently asked questions
Yes, called Activity Monitor, in Applications → Utilities. For simply closing a frozen app, Option-Command-Escape opens the Force Quit window instead.
Sources
Keep reading
More guides to grow your account.